
Kubernetes Monitoring:
Kubernetes (K8s) is a popular open-source container orchestration system that is widely used for deploying and managing containerized applications. K8s monitoring is crucial for ensuring the availability and performance of containerized applications.
We provide K8s monitoring services to help clients monitor and optimize their Kubernetes clusters. Our K8s monitoring services help clients gain visibility into their K8s clusters and detect and troubleshoot issues before they become critical.
Here's a high-level diagram of our K8s monitoring architecture:
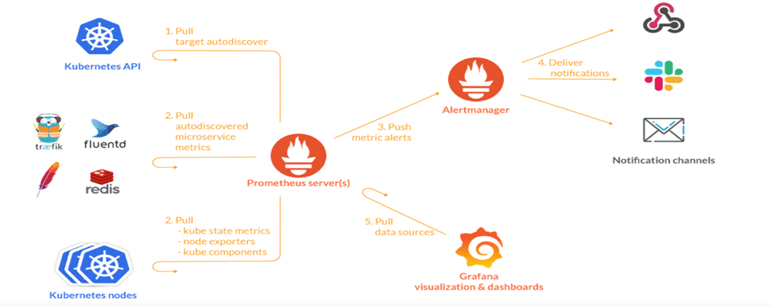
Our K8s monitoring architecture consists of the following components:
- Prometheus: Prometheus is an open-source monitoring system that we use to collect metrics from different sources in the K8s cluster. Prometheus allows us to collect metrics on CPU usage, memory usage, and network traffic, among other things.
- Node Exporter: Node Exporter is a Prometheus exporter that we use to collect system-level metrics from the nodes in the K8s cluster. Node Exporter allows us to collect metrics on CPU usage, memory usage, and disk usage, among other things.
- Kube-state-metrics: Kube-state-metrics is a Prometheus exporter that we use to collect metrics on the state of K8s objects, such as deployments, replicasets, and pods. Kube-state-metrics allows us to collect metrics on the number of running pods, pod status, and deployment status, among other things.
- Grafana: Grafana is an open-source monitoring and data visualization platform that we use to create real-time dashboards for our clients. Grafana provides a user-friendly interface and allows clients to create custom dashboards to monitor their K8s clusters.
- Alert Manager: Prometheus Alert manager is a powerful tool that allows users to manage and handle alerts that are generated by Prometheus client applications. It receives alerts from client applications, then deduplicates, groups, and routes them to the appropriate receivers. This can include email, Slack, PagerDuty, or other notification channels, as specified by the user. With Alertmanager, users can configure complex alerting workflows that ensure that the right people receive the right alerts at the right time. It also provides features such as silencing, inhibition, and aggregation.