
Log Monitoring:
Log monitoring is crucial for detecting and troubleshooting issues in applications and infrastructure. Log monitoring helps clients analyze log data and identify performance issues, security threats, and other anomalies.
We provide log monitoring services to help clients monitor their applications and infrastructure. Our log monitoring services provide real-time log data and alerts to help clients identify and resolve issues before they become critical.
Here's a high-level diagram of our log monitoring architecture:
ELK Stack
Our log monitoring architecture consists of the following components:
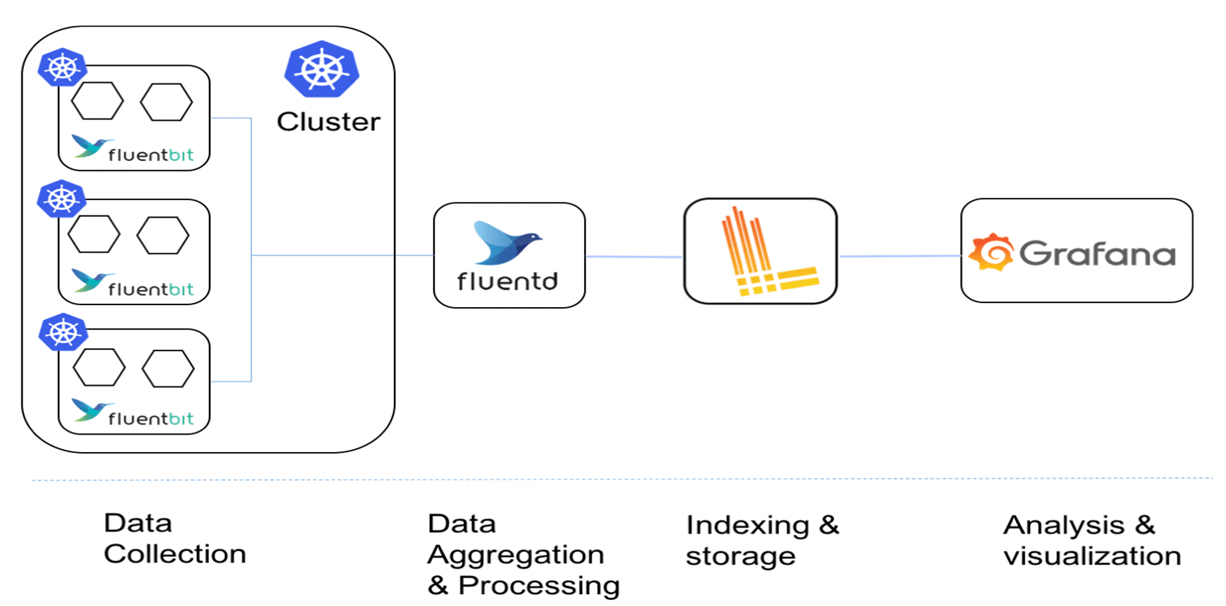
(PLG)
- Promtail: Promtail is a log collector that runs on each server that produces logs. It is responsible for tailing log files, processing them, and sending them to Loki for indexing and storage.
- Loki: Loki is a horizontally scalable, multi-tenant log aggregation system. It stores log data and makes it searchable using a query language inspired by Prometheus.
- Grafana: Grafana is a popular open-source visualization and analytics platform that allows you to query, visualize, alert on, and explore your data.
Promtail and Loki work together to collect and store log data, while Grafana provides the user interface for querying and visualizing that data. Together, these components provide a powerful, scalable, and flexible way to monitor and analyze log data in real-time.
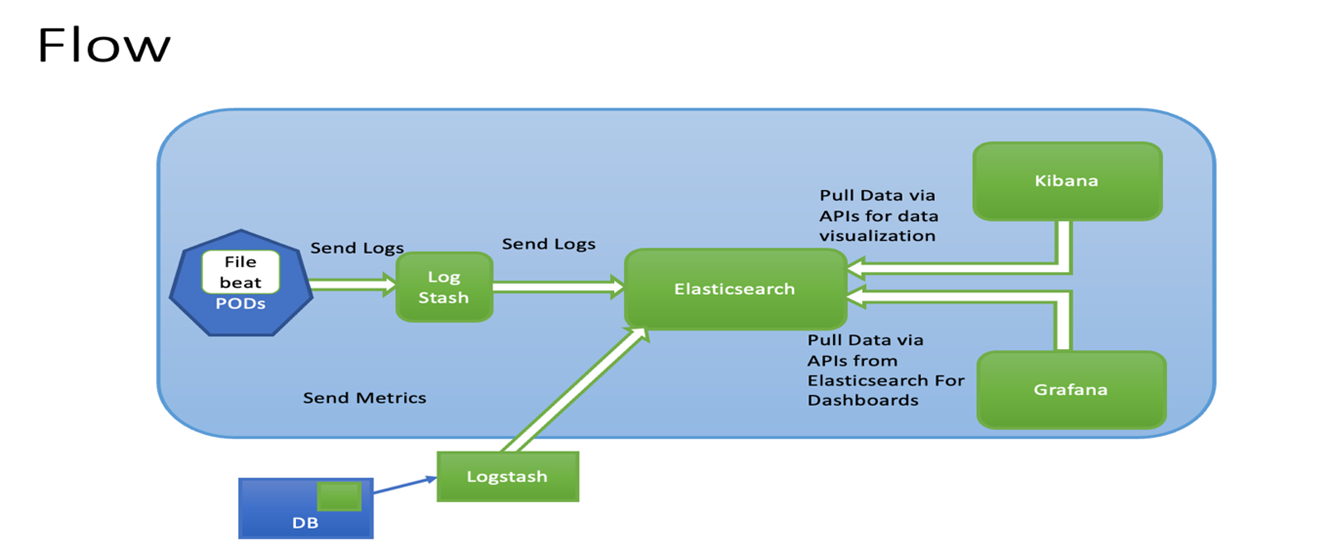
(ELK)
- Elasticsearch: Elasticsearch is an open-source search and analytics engine that we use to store and index log data. Elasticsearch allows us to search and analyze log data in real-time and provides advanced search capabilities.
- Logstash: Logstash is an open-source data processing pipeline that we use to collect, process, and transform log data. Logstash allows us to ingest log data from different sources and transform it into a standardized format for indexing in Elasticsearch.
- Kibana: Kibana is an open-source data visualization platform that we use to create real-time dashboards for log data. Kibana provides a user-friendly interface and allows clients to create custom dashboards and visualizations for their log data.