
Monitoring Solutions:
We provide customized monitoring solutions to help clients monitor their applications and infrastructure. Our monitoring solutions are designed to meet the unique needs of each client and provide real-time metrics and alerts to help clients identify and resolve issues before they impact their applications.
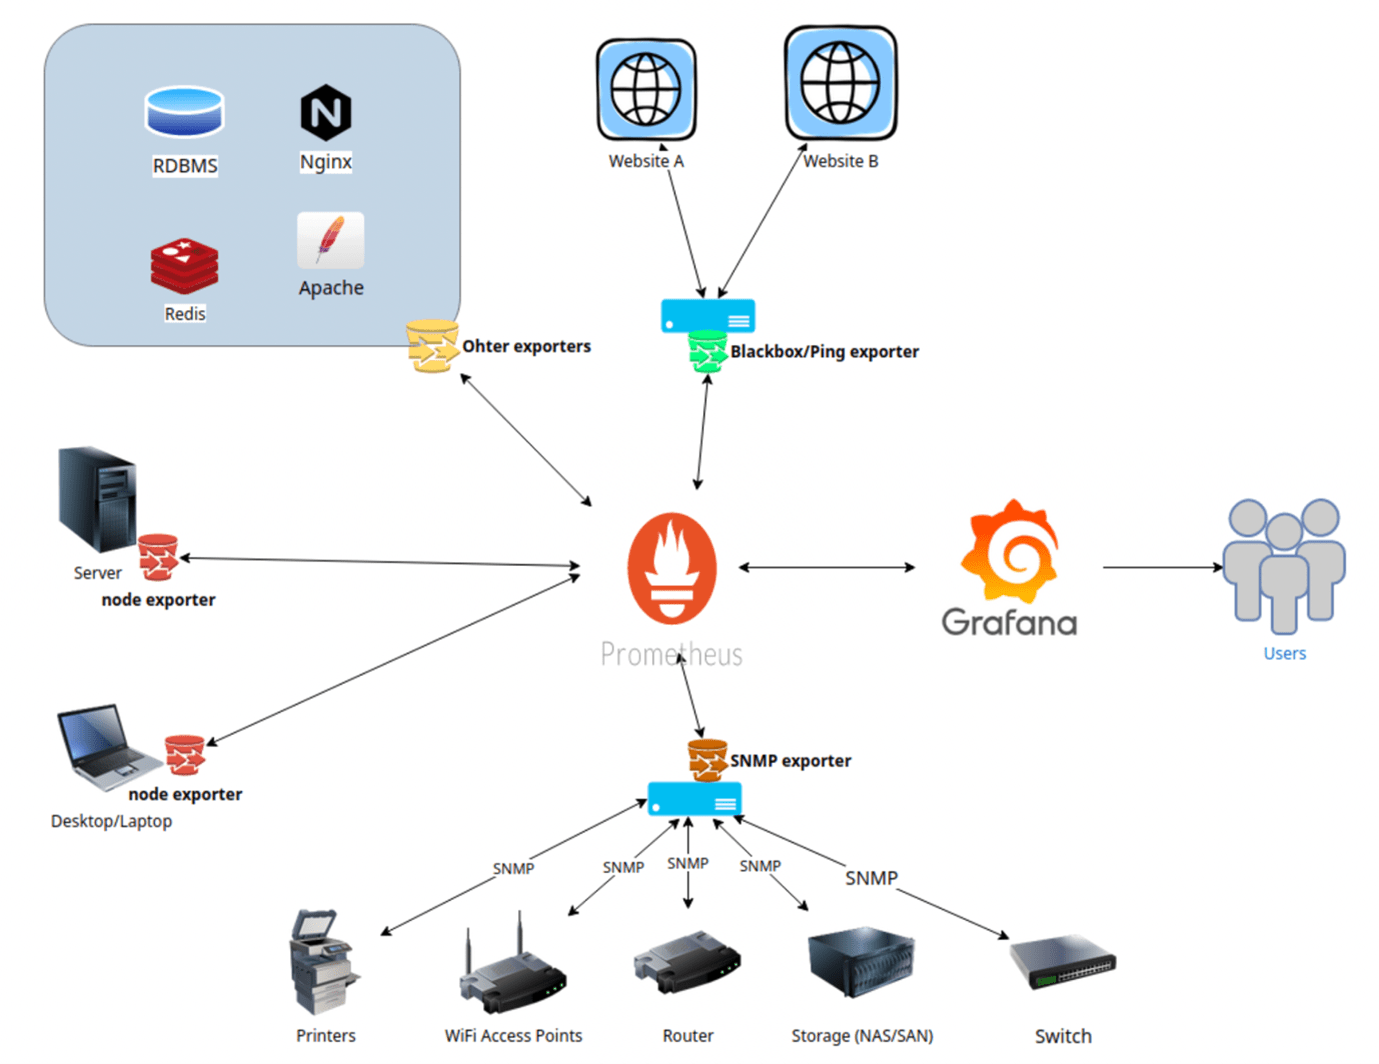
Our monitoring solution architecture consists of the following components:
- Prometheus: Prometheus is an open-source monitoring system that is used for collecting and storing time-series data. It is primarily used for monitoring the performance and health of infrastructure and applications.
- Grafana: Grafana is a popular open-source data visualization tool that is used for creating dashboards and visualizing time-series data from various sources, including Prometheus. It is highly customizable and can be used to display a wide range of metrics and data.
- SNMP Exporter: SNMP Exporter is a tool that is used to collect and expose metrics from SNMP-enabled devices, such as routers, switches, and servers. It allows users to monitor the performance and health of these devices, and visualize the data using tools such as Prometheus and Grafana.
- Blackbox Exporter: Blackbox Exporter is a tool that is used to probe and monitor network endpoints such as HTTP, TCP, and DNS services. It is used to monitor the availability and performance of these endpoints, and expose the data in a format that can be consumed by monitoring tools such as Prometheus.
Node Exporter: Node Exporter is a tool that is used to collect and expose metrics from a Linux or Unix host system. It provides detailed information about the host's CPU, memory, disk usage, network usage, and other key metrics, which can be used for monitoring and troubleshooting purposes.